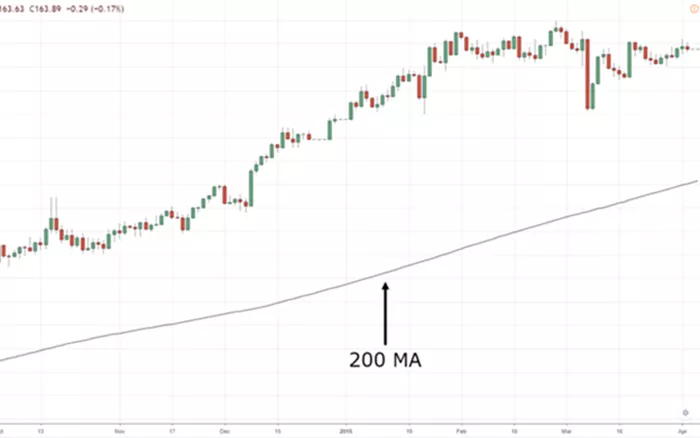
In the world of stock market analysis, technical indicators are crucial tools for investors and traders seeking to understand market trends and make informed decisions. Among these indicators, the 200-day moving average (200-DMA) stands out as one of the most widely used and respected. Its significance lies in its ability to provide a clear view of a stock’s long-term trend by smoothing out short-term price fluctuations. This article delves into the 200-DMA, exploring its calculation, importance, practical applications, and limitations to offer a comprehensive understanding of how this indicator can enhance your investment strategy.
What is the 200-Day Moving Average
The 200-day moving average (200-DMA) is a technical analysis tool that calculates the average closing price of a stock over the past 200 trading days. By averaging these prices, the 200-DMA smooths out daily price fluctuations to reveal the underlying long-term trend of the stock.
Calculation Process
To calculate the 200-DMA, follow these steps:
Collect Closing Prices: Gather the closing prices of the stock for the last 200 trading days.
Sum the Prices: Add these 200 closing prices together.
Divide by 200: Divide the total by 200 to obtain the average.
Formula
- 200-DMA= Sum of closing prices over the last 200 days / 200
This average is updated daily, providing a moving line on a stock chart that reflects the stock’s long-term price trend.
The Importance of the 200-Day Moving Average
Trend Identification
The 200-DMA helps identify long-term trends by smoothing out short-term volatility:
Uptrend: When a stock’s price is consistently above the 200-DMA, it suggests a bullish trend. This indicates that the stock is in a long-term uptrend, and investors may see this as a positive sign.
Downtrend: Conversely, when the stock’s price falls below the 200-DMA, it signals a bearish trend, indicating a long-term downtrend.
Support and Resistance Levels
The 200-DMA often serves as a support or resistance level:
Support Level: In an uptrend, the 200-DMA may act as a support level where the stock price tends to bounce back from if it falls towards this line.
Resistance Level: In a downtrend, the 200-DMA can act as resistance, where the stock price may struggle to rise above this line.
Buy and Sell Signals
Crossovers of the 200-DMA can generate trading signals:
Bullish Signal: When the stock price crosses above the 200-DMA, it may signal a buying opportunity, suggesting a potential start of an uptrend.
Bearish Signal: When the stock price crosses below the 200-DMA, it could signal a selling opportunity, indicating a potential start of a downtrend.
See also: What Does Oversold Mean in Stocks?
Practical Applications of the 200-Day Moving Average
Long-Term Investment Strategy
Investors use the 200-DMA to guide their long-term investment decisions:
Buy and Hold: Investors may buy stocks trading above the 200-DMA and hold them as long as they stay above this level, aligning with the long-term trend.
Avoiding Downtrends: Stocks trading below the 200-DMA might be avoided or sold, reflecting a long-term downtrend.
Portfolio Management
The 200-DMA aids in managing a diversified portfolio:
Rebalancing: Investors may use the 200-DMA to rebalance their portfolios by selling assets that fall below their 200-DMA and buying those that rise above it.
Diversification: It helps assess the performance of various stocks within a portfolio, ensuring alignment with long-term trends.
Combining with Other Indicators
To enhance decision-making, the 200-DMA is often used with other indicators:
Short-Term Moving Averages: Combining the 200-DMA with shorter-term moving averages (e.g., 50-day moving average) can provide additional insights.
Relative Strength Index (RSI): Using the 200-DMA with RSI can help confirm trends and identify overbought or oversold conditions.
See also: What Are Positions in Stocks?
Historical Context and Limitations
Historical Usage
The 200-DMA has been a key tool in technical analysis for decades, valued for its ability to identify and confirm long-term market trends. Its widespread adoption reflects its importance in filtering out short-term market noise.
Limitations
Despite its benefits, the 200-DMA has limitations:
Lagging Nature: As a lagging indicator, it may not react swiftly to sudden market changes, leading to delayed signals.
False Signals: In volatile or sideways markets, the 200-DMA might produce false signals, where the stock price frequently crosses above and below the moving average.
Overreliance: Sole reliance on the 200-DMA can be risky. It should be used in conjunction with other analysis methods and fundamental factors for comprehensive decision-making.
Example Analysis
For example, consider Stock XYZ, which has been trading above its 200-DMA for several months, indicating a strong uptrend. If the stock price then drops and crosses below the 200-DMA, it might signal a shift in market sentiment or a bearish trend. Traders would then seek additional confirmation from other indicators or news before making trading decisions.
Conclusion
The 200-day moving average is a powerful tool in technical analysis, offering valuable insights into long-term stock trends, support and resistance levels, and potential buy or sell signals. While it is a useful indicator for identifying and confirming trends, it is important to be aware of its limitations and avoid overreliance. By combining the 200-DMA with other technical and fundamental analysis methods, investors and traders can make more informed decisions and navigate the complexities of the stock market with greater confidence. Understanding and applying the 200-DMA effectively can enhance your investment strategy and improve your ability to identify profitable opportunities.
Related Topics:

