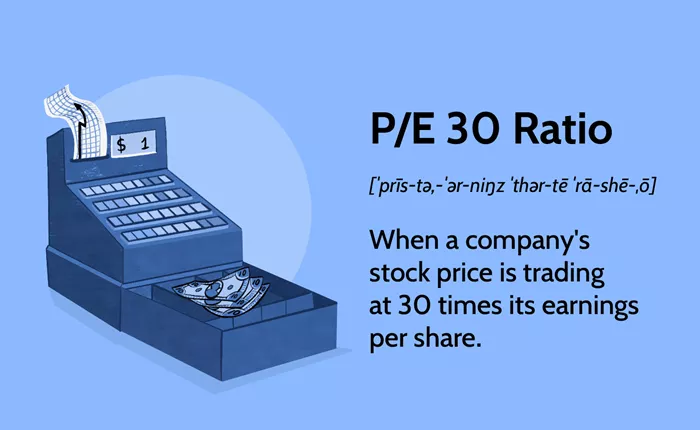
The Price-to-Earnings (P/E) ratio is a key financial metric used by investors to evaluate the valuation of a company’s stock. It provides insight into how much investors are willing to pay for each dollar of a company’s earnings, helping to assess whether a stock is overvalued, undervalued, or fairly priced. Understanding the P/E ratio is crucial for making informed investment decisions. This article delves into the P/E ratio, its calculation, types, implications, and limitations.
Definition of the P/E Ratio
The P/E ratio is a valuation ratio, calculated by dividing a company’s current share price by its earnings per share (EPS). It indicates how much investors are paying for each dollar of the company’s earnings. The formula for the P/E ratio is:
- P/E Ratio= Current Share Price / Earnings Per Share (EPS)
Earnings Per Share (EPS)
EPS represents a company’s profit allocated to each outstanding share of common stock. It is calculated as:
- EPS= Net Income−Dividends on Preferred Stock / Number of Outstanding Shares
Types of P/E Ratios
Trailing P/E Ratio
The trailing P/E ratio uses earnings from the past 12 months. It reflects the company’s historical performance and is commonly used for its availability and reliability.
Formula:
- Trailing P/E Ratio= Current Share Price / Trailing Twelve Months (TTM) EPS
Example: If a company’s current share price is $100 and its trailing EPS is $5, the trailing P/E ratio would be 20 ($100 / $5).
Forward P/E Ratio
The forward P/E ratio uses projected earnings for the upcoming 12 months. It is useful for assessing future performance and potential growth.
Formula:
- Forward P/E Ratio= Current Share Price / Forecasted EPS
Example: If a company’s current share price is $100 and its projected EPS is $7, the forward P/E ratio would be approximately 14.3 ($100 / $7).
Shiller P/E Ratio (Cyclically Adjusted P/E or CAPE Ratio)
The Shiller P/E ratio uses the average inflation-adjusted earnings of the past 10 years. It is designed to smooth out fluctuations and provide a longer-term view of valuation.
Formula:
- Shiller P/E Ratio= Current Share Price / Average Inflation-Adjusted EPS Over 10 Years
Example: If a company’s current share price is $100 and its 10-year average inflation-adjusted EPS is $6, the Shiller P/E ratio would be approximately 16.7 ($100 / $6).
See also: What Does 52 Week Range Mean in Stocks?
Interpretation of the P/E Ratio
High P/E Ratio
A high P/E ratio can indicate that a stock is overvalued or that investors are expecting high growth rates in the future. It suggests that investors are willing to pay a premium for the company’s earnings.
Implications: A high P/E ratio may be justifiable if the company is expected to experience significant growth. However, it may also suggest potential overvaluation or high risk if growth expectations are not met.
Low P/E Ratio
A low P/E ratio can suggest that a stock is undervalued or that the company is experiencing difficulties. It may also indicate lower growth expectations from investors.
Implications: A low P/E ratio might present a buying opportunity if the company’s fundamentals are strong and there are prospects for improvement. However, it could also reflect underlying problems or industry challenges.
Comparing P/E Ratios
The P/E ratio is most useful when compared to:
Industry Peers: Comparing a company’s P/E ratio to that of its industry peers helps assess relative valuation.
Historical P/E Ratios: Comparing the current P/E ratio to historical levels for the same company can indicate whether the stock is trading at a premium or discount.
Market Averages: Comparing the company’s P/E ratio to the broader market average provides context for its valuation.
Advantages and Limitations of the P/E Ratio
Advantages
Simplicity: The P/E ratio is easy to calculate and understand.
Valuation Comparison: It helps in comparing the valuation of different companies.
Growth Expectations: It reflects investor expectations for future growth.
Limitations
Earnings Volatility: The P/E ratio can be misleading if a company’s earnings are volatile or negative.
Growth Variability: It does not account for differences in growth rates among companies.
Non-Consideration of Debt: The P/E ratio does not factor in a company’s debt, which can impact overall financial health.
Accounting Differences: Variations in accounting practices can affect EPS calculations, leading to inconsistencies in P/E ratios.
See also: What Is a Ticker in Stocks?
Practical Examples and Case Studies
Technology Sector
Technology companies often have higher P/E ratios due to expectations of rapid growth. For instance, if a leading tech company has a P/E ratio of 50 compared to a traditional manufacturing company with a P/E ratio of 15, the tech company’s higher ratio reflects anticipated higher growth.
Value Investing
Value investors might seek stocks with low P/E ratios, considering them undervalued. For example, a retail company with a P/E ratio of 10 might be seen as undervalued compared to the industry average of 20, provided the company has solid fundamentals.
Conclusion
The P/E ratio is a fundamental tool for evaluating stock valuation, offering insights into how much investors are willing to pay for a company’s earnings. While it provides valuable information, it should be used in conjunction with other financial metrics and analyses to make well-informed investment decisions. Understanding both the advantages and limitations of the P/E ratio allows investors to better assess stock valuations, identify potential investment opportunities, and avoid pitfalls associated with overvalued or undervalued stocks. By examining the P/E ratio alongside industry comparisons, historical data, and growth expectations, investors can gain a more comprehensive understanding of a company’s financial health and make strategic investment choices.
Related Topics:

